

Beyond Traditional Signal Detection: Advancing Pharmacovigilance Through Quantitative Epidemiology
Vasudev Bhupathi, Director, Clinical Safety Science, Moderna
Emerging therapeutic modalities demand increasingly sophisticated pharmacovigilance approaches. This article proposes integrating quantitative signal detection, longitudinal safety surveillance, and epidemiological assessment to strengthen postmarketing safety evaluations. By addressing limitations of conventional disproportionality methods, the proposed framework offers a pathway towards more evidence-driven signal prioritisation, regulatory decision-making, and patient safety.
Beyond Counting Reports
The emergence of increasingly targeted medicines is changing the questions that pharmacovigilance must answer. Antibody–drug conjugates, cellular therapies, gene-based treatments and other advanced modalities can provide substantial therapeutic benefit, yet their safety profiles may reflect complex biological mechanisms, heterogeneous patient populations and delayed effects. Detecting a numerical imbalance in adverse-event reports is important, but it is only the beginning of a scientific investigation.
Modern pharmacovigilance therefore needs to ask more than whether an event has been reported disproportionately. Is the pattern persistent? Does it occur at a biologically plausible time? Is it consistent across studies, doses or patient subgroups? Could the underlying disease or concurrent treatment explain the observation? Most importantly, would further investigation change clinical care or the benefit–risk assessment? Bringing quantitative epidemiology into routine signal management helps structure these questions and separate preliminary alerts from evidence that merits action.
What Conventional Methods Can and Cannot show
Spontaneous reporting systems remain essential for detecting uncommon or unexpected events after approval. Disproportionality measures such as the reporting odds ratio (ROR), proportional reporting ratio (PRR) and Bayesian shrinkage statistics can highlight drug–event combinations reported more frequently than expected relative to other combinations in the database. Their value lies in screening large collections of imperfect data efficiently.
Their limitations are equally important. Reporting may increase after media attention, regulatory communications or a new indication. Duplicate cases, incomplete medical histories, variable terminology and changes in prescribing can distort apparent trends. Crucially, spontaneous reports generally lack a reliable denominator of all exposed patients. The number of reports, or an ROR, cannot establish incidence, comparative risk or causality. A statistically prominent signal may reflect attention rather than biology; a clinically important rare event may initially fail a conventional reporting threshold.
The European Medicines Agency distinguishes signal detection from validation, prioritisation, assessment and recommendations for action. That sequence reflects a fundamental principle: an algorithm may flag a question, but clinical and epidemiological evidence must determine how it should be investigated.
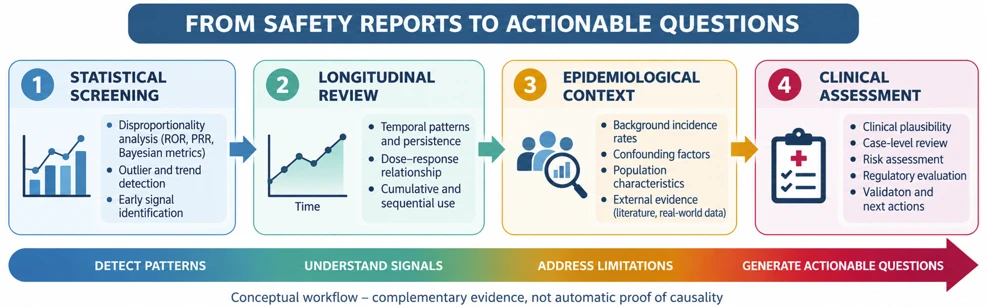
Figure 1. Proposed evidence-informed signal assessment pathway. Original conceptual illustration.
The Epidemiological Dimension
Quantitative epidemiology adds three capabilities that are sometimes underused in routine signal discussions. First, it places events in context. Background disease incidence, patient age, comorbidities and treatment indication may strongly influence the number of events expected even without a drug effect. Second, it examines time: latency after exposure, cumulative treatment duration, calendar trends and persistence across observation windows. Third, it requires explicit attention to selection bias, confounding, missing data and the validity of outcome definitions.
The available data determine the question that can reasonably be answered. Clinical trials with known exposed populations can support exposure-adjusted incidence rates and comparisons across treatment arms, although small samples may limit rare-event detection. Electronic health records and claims databases can support comparative cohort or self-controlled designs if exposure, follow-up and confounders are captured adequately. Spontaneous reports and literature mentions are more appropriate for signal generation and prioritisation than direct risk estimation. Integrating these sources does not mean treating them as statistically interchangeable.
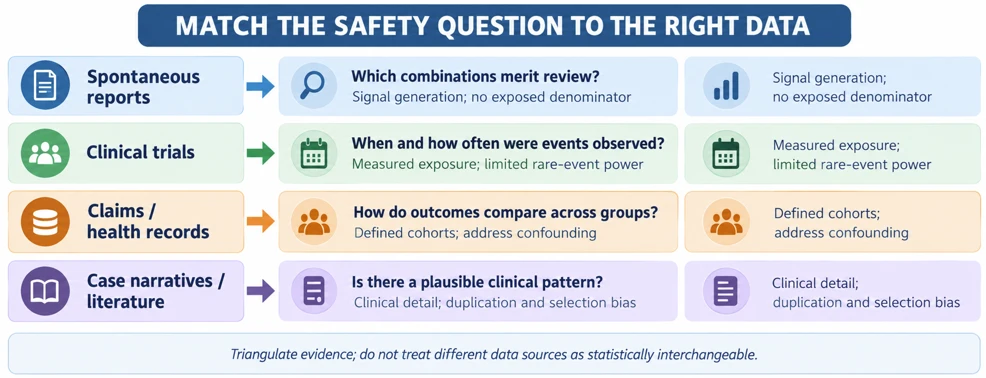
Figure 2. Complementary roles and limitations of major pharmacovigilance and epidemiological data sources. Original illustration.
Consider an event observed among older adults receiving several treatments for advanced cancer. A disproportionate reporting signal may initially look persuasive, yet the event may also be common in untreated patients with similar disease severity. A useful investigation begins by specifying an appropriate clinical question, such as whether incidence differs between therapies used for the same indication. The team can then select a suitable comparator population, define a risk window and adjust for age, comorbidity and prior treatment. This prevents a database alert being mistaken for an answer to a causal question.
For uncommon outcomes, a further distinction is needed between absolute and relative measures. A large relative association involving a very rare outcome may have a different clinical impact from a modest relative increase in a common severe outcome. Risk assessment also considers reversibility, availability of monitoring, alternative treatment options and therapeutic benefit. Quantitative analysis becomes clinically useful when its estimates are matched to decisions that physicians and patients actually face.
Four Practical Signal-Assessment Examples
A first example is longitudinal surveillance of an emerging imbalance. Rather than comparing only cumulative counts, a safety team might compare the current quarter with preceding periods, examine changes in the number of patients exposed and assess whether the increase persists. A twofold change in a reporting metric could serve as an investigation trigger, not as proof of a new adverse drug reaction. An apparent increase may disappear after duplicate removal or may coincide with a change in enrolment or reporting intensity. This practical form of trending illustrates the value of structured review over a single static threshold.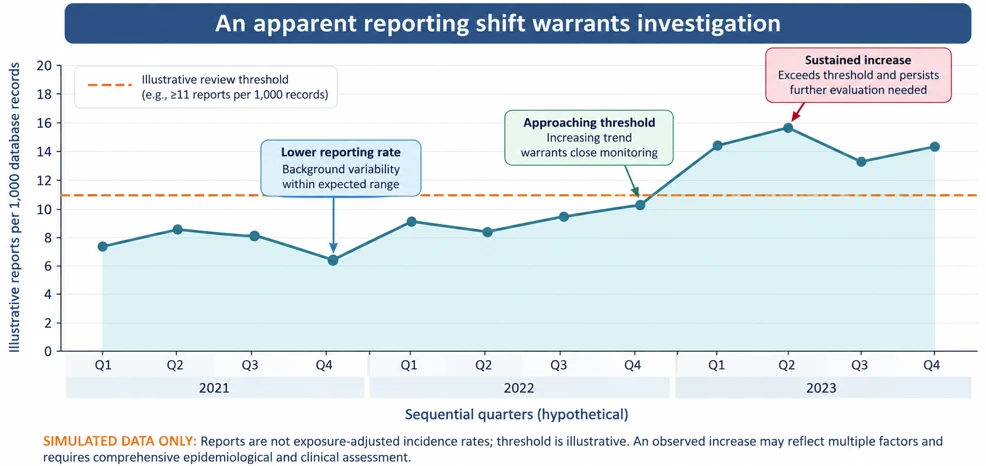 Figure 3. Hypothetical quarterly reporting pattern, for illustration only. The synthetic values are not clinical findings or evidence of medicine-related risk.
A second example comes from long-term clinical safety evaluation. A published 52-week extension study of olanzapine/samidorphan reported that 277 participants received treatment and that mean weight increases stabilised by approximately week six, with limited further change through the study. This longitudinal observation illustrates the importance of repeated measurement rather than relying on a short initial safety window. Such patterns illustrate why the timing of first onset and changing numbers of patients at risk matter. Such observations do not, without a suitable comparator and appropriate adjustments, demonstrate that individual patients become less susceptible with time. For a safety team, the lesson is to combine adverse-event timing, exposure duration and attrition with clinical interpretation.
A third example concerns targeted oncology therapies. The US prescribing information for trastuzumab deruxtecan includes a boxed warning for interstitial lung disease and pneumonitis, including fatal cases. A useful surveillance programme would not stop at counting pulmonary-event terms. It would examine clinical presentation, latency, severity, dose history, competing causes, monitoring practices and changes across indications. Where reliable denominators and comparison populations exist, epidemiological studies could help quantify incidence or relative risk. The purpose is to translate a safety concern into actionable monitoring and risk minimisation.
A fourth example shows the importance of combining sources for emerging modalities. In November 2023, the US Food and Drug Administration reported investigating T-cell malignancies after BCMA-directed or CD19-directed CAR-T therapies. In April 2024, the agency announced class-wide boxed-warning changes, drawing on postmarketing and clinical-trial reports. This regulatory sequence illustrates why a small number of serious events may merit close evaluation when biological plausibility, severity and potential long-term consequences are significant. It should not be represented as proof that any particular signal-detection algorithm alone identified or confirmed the risk.
A Multidimensional Framework for Prioritisation
A practical next step is to organise existing evidence into a transparent, repeatable framework. One dimension is statistical strength: disproportionality estimates, confidence intervals, Bayesian shrinkage and the number of distinct reports. A second is longitudinal consistency: whether an imbalance appears repeatedly, changes after product launch or remains stable despite reasonable changes in the observation window. A third is clinical and epidemiological context: plausible latency, dose or exposure relationships, relevant baseline risks, differences across patient groups and competing explanations. A fourth is evidence convergence: whether clinical trials, case narratives, laboratory findings, mechanistic studies and suitably designed observational studies point in compatible directions.
These dimensions should not be collapsed uncritically into a single score. Highly correlated statistical metrics do not become independent confirmations merely because several exceed their thresholds. Likewise, a missing subgroup effect may reflect sparse data rather than reassurance. Any proposed prioritisation score requires prespecified definitions, evidence-quality checks and validation against independently recognised safety outcomes. The purpose is to make judgement more consistent and auditable, not to replace medical review.
An operational workflow would begin with a documented candidate signal, proceed to case-level validation and quantitative characterisation, assess alternative explanations, and assign a decision: close with rationale, continue targeted surveillance, undertake an aggregate review, or initiate an appropriately designed pharmacoepidemiological study. Findings and unresolved uncertainties should be revisited as exposure and evidence accumulate.
These decisions also need proportionality. A serious, plausible event that is potentially preventable may warrant expedited scrutiny even when reported infrequently. Conversely, a common but expected and reversible event may be better addressed through established monitoring rather than repeated emergency escalation. Structured records should explain the rationale, the evidence reviewed, the limitations and the planned reassessment date. In this way, signal prioritisation becomes a documented scientific process rather than a contest between statistical thresholds.
Could Statistical Process Control Improve Surveillance?
Statistical process control provides another hypothesis worth testing. Western Electric rules, originally developed for detecting non-random changes in monitored processes, can flag an unusually extreme observation or a sustained run of observations on one side of a historical mean. Applied cautiously to literature mentions or safety-reporting trends, such rules might prompt investigation of emerging changes that would be missed by an isolated monthly or quarterly comparison.
However, published article counts and adverse-event reports are not stable industrial measurements. Publication volume, media attention, database indexing, seasonality and product uptake can shift over time. Standard control limits may generate misleading alerts when counts are sparse, autocorrelated or strongly time-dependent. The proposed approach should therefore be treated as an exploratory surveillance tool requiring appropriate count models, adjustment for changing information volume, simulations and out-of-time validation. There is currently no empirical result presented here showing that Western Electric rules improve pharmacovigilance sensitivity or patient outcomes.
For literature-based monitoring, the numerator itself needs careful definition. One review may describe several patients while several papers may describe the same case. Reviews can repeat previously published concerns without adding new evidence. Counting articles as though they were independent patient events would inflate the perceived importance of a topic. A defensible monitoring system could classify original cases, observational studies, clinical trials and narrative reviews separately, alongside measures of total publication activity. Only then should unusual patterns trigger expert review.
From Signal to Public-Health Evidence
When an initial signal remains credible after medical review, the next question is often best addressed with a stronger study design. A cohort study may compare outcome rates in well-defined exposed and comparator groups, with adjustment for confounding by indication and baseline risk. A self-controlled case series may be useful for selected acute events when its assumptions are met. Case-control studies or registry-based follow-up may be more feasible for rare or delayed outcomes. Sensitivity analyses can test whether conclusions depend on outcome definitions, exposure windows or unmeasured confounding.
Success should not be defined simply as producing more alerts. Relevant measures include detection of independently recognised safety concerns, time to detection, false-alert burden, reproducibility across datasets and the resources required for clinical review. Historical validation must prevent information from later regulatory decisions leaking into earlier predictions. In the absence of such evaluation, an integrated framework remains a promising proposition rather than a demonstrated improvement.
Implementation and Governance
Successful implementation requires more than software. Safety physicians, epidemiologists, statisticians, clinical development teams and regulatory professionals should agree in advance on the safety topics of interest, data-quality rules, thresholds for escalation and documentation standards. Case-level review should remain connected to longitudinal aggregate assessment, especially where programmes span multiple studies or indications.
Automation can help standardise terminology, reconcile duplicates, visualise trends and preserve an audit trail. Its outputs nevertheless need review for bias, clinical relevance and reproducibility. For advanced therapeutic modalities, long-term follow-up and evolving disease context are especially important. Clear governance protects against two opposite errors: dismissing an important but initially sparse concern, and overinterpreting a noisy numerical association.
Conclusion
The future of pharmacovigilance is not a choice between traditional signal detection and advanced quantitative methods. Effective patient-safety surveillance requires both. Disproportionality screening creates useful leads; temporal analysis, aggregate clinical review and epidemiological investigation determine what those leads mean. Public regulatory examples and clinical-development experience show why timing, disease context, seriousness and evidence convergence matter.
A multidimensional framework can offer a disciplined approach to prioritisation, but its advantages must be tested rather than assumed. By applying epidemiological reasoning to the entire signal-management pathway, pharmacovigilance can become more transparent, proportionate and responsive to the safety challenges of emerging medicines.
References for online publication
- European Medicines Agency. Guideline on good pharmacovigilance practices (GVP), Module IX: Signal management (Rev 1). 2017. https://www.ema.europa.eu/en/documents/scientific-guideline/guideline-good-pharmacovigilance-practices-gvp-module-ix-signal-management-rev-1_en.pdf
- European Network of Centres for Pharmacoepidemiology and Pharmacovigilance. Guide on methodological standards in pharmacoepidemiology, Chapter 11: Signal detection methodology and application. https://encepp.europa.eu/encepp-toolkit/methodological-guide/chapter-11-signal-detection-methodology-and-application_en
- US Food and Drug Administration. FAERS reporting and review: Information for users. https://www.fda.gov/media/165667/download
- US Food and Drug Administration. ENHERTU (fam-trastuzumab deruxtecan-nxki): Prescribing information. 2022. https://www.accessdata.fda.gov/drugsatfda_docs/label/2022/761139s024lbl.pdf
- US Food and Drug Administration. FDA requires boxed warning for T cell malignancies following treatment with BCMA-directed or CD19-directed autologous CAR T cell immunotherapies. 18 April 2024. https://www.fda.gov/vaccines-blood-biologics/safety-availability-biologics/fda-requires-boxed-warning-t-cell-malignancies-following-treatment-bcma-directed-or-cd19-directed
- Long-term safety and durability of effect with a combination of olanzapine and samidorphan in patients with schizophrenia: Results from a 1-year open-label extension study. CNS Spectrums. 2020. https://pubmed.ncbi.nlm.nih.gov/32393412/
- Hendrickson BA, Wang W, Ball G, et al. Aggregate safety assessment planning for the drug development life-cycle. Therapeutic Innovation & Regulatory Science. 2021;55:717–732.

Vasudev Bhupathi is Director of Clinical Safety Science at Moderna, with over two decades of experience in pharmacovigilance, clinical safety, and drug development. His expertise spans oncology, neuroscience, and vaccines. He is a PhD candidate in Public Health–Epidemiology, focusing on quantitative research, patient safety, and real-world evidence methodologies.