
How to Build a Metrics-Driven Culture in Pharma Quality Management
Kavita Vengurlekar, Vice President - Data and Insights, Caliber Technologies
This article explores how pharma companies can build a metrics-driven quality culture that empowers teams and strengthens regulatory trust. It highlights critical QA metrics, real-world use cases, and best practices for embedding metrics into daily work and how digital platforms enable real-time visibility for continuous GMP improvement.
An organisation’s quality culture is reflected in its quality metrics. Metrics reveal how the organisation really values quality, how quickly it acts on a deviation, and whether it is truly solving problems or just managing temporary fixes.
What does this look like? Here is an example of a sterile facility review meeting where the leadership does not start the discussion with a long list of deviations. They start with three live numbers - Lot Acceptance Rate, Deviation Recurrence Rate, and CAPA Timeliness. The numbers show that recurrence was reduced by 32% in the past six months. The team notices two operator errors that led to almost 40% of the deviation recurrence. This immediately puts the spotlight on the action to be taken to fix the numbers at the source. By the time the next review meeting happens, these numbers will have assuredly improved.
This is the cultural shift that metrics can drive. Regulators today are looking to see this approach within manufacturing and quality teams. They want teams to look at quality metrics as a decision-making framework rather than just as a compliance checkbox.
They are also keen to see how companies are performing on metrics such as Right-First-Time rate, Lot-release cycle time. Indicators like change-control effectiveness, overall equipment effectiveness (OEE) reveal how well their quality system responds to deviations and improvements. Labs are furnishing an invalidated out-of-specification rate (IOOSR), Right-First-Time testing, and calibration timeliness. Inspectors are also tracking the reliability of deliveries and an organisation’s ability to meet demands with on-time and in-full (OTIF) and fill rates.
The Quality Metrics proposal by the USFDA seeks to help companies demonstrate real control through data. It is also backed by the FDA’s Quality Management Maturity (QMM) program. Apart from the FDA, the WHO and EMA are keenly looking at how companies are driving continuous improvement. Quality metrics are now at the heart of every pharma company’s goals – audit readiness, operational excellence, and regulatory credibility.
Metrics That Matter in Pharma QA
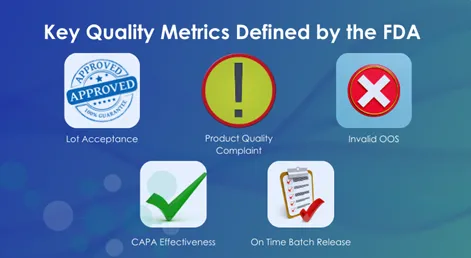
Since regulators are raising the bar, it is now more important to know which metrics or numbers to watch regularly. These four metrics will provide visibility into what and how much control the quality team has, more than any 40-page report.
- Lot Acceptance Rate (LAR) – A steady LAR keeps the quality team at peace. However, a sudden dip may indicate that it is time to check on calibration, raw materials, or operator handling.
- Out-of-Specification (OOS) Rate – OOS spikes often hint at method execution errors or equipment variability. With AI-powered systems, it has become easy to pinpoint probable root causes within hours.
- CAPA Closure Time—While closures do not necessarily indicate speed, they show how promptly a company is equipped to address a deviation. Auto-routing CAPA tasks to effective, timely closures can be best done with eQMS systems.
- Deviation Recurrence—A recurring deviation means the root cause was not fully fixed. This means there is a need to use automated systems that alert when they find deviation patterns.
All these metrics are interlinked and affect each other and the company’s efficiency. When the OOS rate is high, it is likely to destabilize LAR. Long CAPA closures can lead to deviation recurrence. So, when one understands the bigger impact and starts connecting the dots, one can act faster and smarter. That’s what digital quality metrics systems are shaping up to do– they turn raw data into early warnings for safer, smarter operations.
Making Metrics Part of the Culture
Metrics-driven culture should not stay in the books; it must be understood and implemented by everyone, including the line operator or site head. Today, metrics are not a QA function only, they are a company’s language. Small steps can make this happen.
- Make metrics part of regular discussions: Ask the right questions, like, 'Why was the LAR down by three points last week?' during regular reviews. This pushes the quality team to keep metrics in check even before the next quarterly meeting. Companies can act faster, and quality is under control.
- Display numbers where the work happens: If GMP inspection metrics are in the production areas, operators can spot and alert supervisors about an unusual trend. Actions taken swiftly can prevent big issues.
- Capture data using eQMS: Automating data collection through an eQMS saves time for teams to fix issues faster without any worry about data integrity or log duplication.
- Let dashboards talk: Empower production managers on the shop floors with real-time, visual dashboards. Next is to ask upfront questions like ‘What’s causing this?’ on the floor rather than waiting for QA to investigate.
- Detect issues, don’t defend them: Act on the metrics. They are designed to spot issues early. Regulators always want to see the shift from reactive to proactive reporting.
- Ask more ‘Whys’: Metrics discussions must be actively discussed just like production targets. Using problem-solving tools like the 5-Why method or Ishikawa diagram (or fishbone analysis) can help get to the root of the metrics fluctuations. Keep asking until a fix is found.
Bringing this cultural change is imperative. Modern companies are facing unprecedented challenges and severe competition. Supply chains are tighter, and product cycles are shorter. In all this, regulators are expecting to see more data. A batch failure, warning letter or recurring deviations may erode patient and regulatory trust.
Real-World Stories
- A sterile manufacturing facility saw repeated delays in release timelines. They started using a metrics framework that focused on CAPA timelines, change control, and deviation recurrence. This became an important part of their daily review. Metrics gave them a clear lens into where things were going wrong. It helped the leadership to remove roadblocks in real time. As a result, deviations were closed faster with lesser repeats.
- A 483 issued in 2022 to a mid-size injectables site stated that the company had too many OOT excursions and that they were not analyzed systematically. They soon started tracking live KPIs like average OOT per batch and OOS rate per 1,000 tests. This turned reactive investigations into predictive measures. By integrating their LIMS data into a metrics dashboard, their QA could act before deviations became big problems. This improved OOS results, and the site reported zero citations in the following inspection.
- During an inspection at a generics manufacturing site, the inspector noticed missing critical entries and that the reviews were conducted after weeks after batch release. The site did not have consistent metrics for recording the delays. They deployed a digital quality metrics system linked to its eQMS. With this, their documentation errors reduced by 50%, review cycle times dropped by 35%, and the site successfully demonstrated a metrics-driven model during the next inspection.
Building Trust Through Metrics
Numbers speak the truth. When companies are confident about their data and processes, it automatically instills trust, both internally and externally. When teams see that metrics can prevent problems, they follow them more closely.
Along with the trust from the workforce, metrics also build trust with regulators, partners, and even patients. Real-time dashboards tell inspectors how the company is continually improving its processes. When a quality team faces auditors confidently and does not have to give defensive explanations, the impact of a metrics-driven culture can be clearly seen.
Best Practices for Metrics-Driven GMP Improvement
Companies must accept that cultural change takes time, especially in a regulated environment. Including metrics as a part of the organisational culture is a behavioral change, more than just implementing a digital system framework. With quick, high-impact steps, pharma sites can adapt to this change effectively.
- Start small, but maintain consistency – Pick only a few, three or four metrics to start with. Track them relentlessly and slowly add more metrics to the list.
- Encourage teams to look for the ‘Why’ - Before adding a new SOP, get into the habit of finding the root cause. Teams must use tools such as the 5-Why or Ishikawa diagram to understand what is causing the problem.
- Adopt smarter systems—Use smart, digital quality metrics platforms to capture data in real time. This ensures that you adhere to consistent definitions and reviews all the time.
- Tie metrics to performance – Make positive metric trends a basis for incentives or role-based accountability. This promotes improvement in quality outcomes.
These practices will help in driving a metrics-driven quality culture and transform GMP metrics into an everyday improvement engine.
How Leaders Can Drive the Quality Metrics Pulse
While best practices set the rhythm, the leaders keep the pulse alive and steady. Catching up with metrics daily is what pharma leaders and site heads can practice consistently. The senior management must ensure that automation tools are integrated well into the system, capturing data accurately from different systems and generating live metrics. They also should dive in to fix bottlenecks and help teams navigate their metrics to achieve desired numbers. When leaders nurture the habit of metrics monitoring, teams feel secure, motivated, and focused.
Quality Metrics—Change Your Quality Game with Powerful Metrics
For metrics to help draw conclusions and promote decision-making, it is important to use the right tools. Moreover, if your data lives in silos, it loses its power, and leaders can’t act in time. It also fails to earn regulators’ trust as they would see only snapshots rather than a living picture of control.
It is always good to have all the metrics displayed in real time—in a single view. Modern, digital quality metrics platforms are making this possible. They are turning metrics into live conversations. Therefore, now quality metrics have better visibility, speed, and context to the numbers that matter the most. Measuring the right metrics and making them visible at the right time and in the right way, both play an important role in navigating the essence of a metrics-driven culture.

Dr. Kavita is a seasoned leader in the field of data and insights, with over two decades of experience in designing and delivering transformative solutions in data warehousing and big data analytics. She has successfully translated deep technical expertise in data warehousing, business intelligence, and analytics into impactful business outcomes. She drives D&I innovations at Caliber Technologies. Under her visionary leadership, the CaliberAPQR application has earned industry-wide recognition for redefining Annual Product Quality Review in the pharmaceutical sector.